


Month-over-Month (MoM) growth rate measures the percentage change in a metric, revenue, users, signups, between the current month and the previous one. The formula is ((Current − Previous) ÷ Previous) × 100. It's the go-to metric for spotting short-term trends fast, especially for startups.
What is Month over Month (MoM) Growth Rate?
Have you ever wondered how businesses track their progress from one month to the next? That’s where Month over Month (MoM) Growth Rate comes in. It’s a simple way to measure how much something grows or shrinks compared to the previous month.
Definition
Month over Month (MoM) Growth Rate is a business metric that measures the percentage change in a specific value between the current month and the previous month.
Why is Month over Month (MoM) Growth Important?
Month over Month growth is one of the most valuable metrics for businesses because it helps you spot trends quickly and make smart decisions.
Here’s why it matters:
- Quick Problem Detection: MoM growth is like an early warning system. If your numbers start dropping, you’ll know right away. For example, if your online store’s sales drop 15% from last month, you can investigate and fix problems before they get worse.
- Better Planning: Tracking MoM growth helps you prepare for future trends. If your business grows 10% every month during summer, you can hire extra help or stock more inventory before the busy season starts.
- Measuring Marketing Success: MoM growth reveals the impact of your marketing efforts. For example, if a new ad campaign leads to a 25% increase in sales, it indicates your marketing strategy is effective.
- Investor and Bank Relations: Banks and investors love seeing steady MoM growth. Consistent monthly growth, even if small, demonstrates business health and can improve your chances of securing funding.
- Competitive Edge: MoM growth helps you compare yourself with competitors. If your customer base grows 5% a month while a competitor you track grows 3%, you are pulling ahead.
- Goal Setting: Knowing your typical monthly growth rate makes setting realistic goals easier. For example, if you typically grow 8% MoM, aiming for 10% is both ambitious and achievable.
The simplicity of MoM growth makes it ideal for quick decision-making and staying on track. However, it’s best used alongside other metrics for a complete view of your business health.
How to Calculate Month-over-Month Growth Rate
The formula for calculating Month-over-Month Growth Rate is:
MoM Growth = ((Current Month − Previous Month) ÷ Previous Month) × 100Percentage change vs last month
Example Calculation
If your monthly revenue was:
- March: $10,000 (Previous Month)
- April: $12,000 (Current Month)
(($12,000 − $10,000) ÷ $10,000) × 100 = 20%March $10K → April $12K
Handling Negative Growth
The same formula applies for negative growth. For example:
- June: $15,000 (Previous Month)
- July: $12,000 (Current Month)
Calculation:
($12,000 – $15,000) = -$3,000
-$3,000 ÷ $15,000 = -0.2
-0.2 × 100 = -20%
Your MoM growth rate is -20%.
MoM Growth vs Annual Growth: Reconciling the Compounding Math
A critical distinction: a 10% MoM growth rate does NOT equal 120% annual growth. Month-over-month growth compounds. When you grow consistently at 10% per month for 12 months, you multiply your starting revenue by 1.10 each month, not add 10% each time.
Annual Multiplier = (1 + Monthly Rate ÷ 100)^12Compounding formula
Example: 10% MoM growth sustained over 12 months
- Starting MRR: $5,000
- Month 1: $5,000 × 1.10 = $5,500
- Month 2: $5,500 × 1.10 = $6,050
- Month 3: $6,050 × 1.10 = $6,655
- Month 12: $5,000 × (1.10)^12 = $15,692
$5,000 × (1.10)^12 = $15,692 = 3.14x multiplier10% MoM = 214% annual growth
Example: 15% MoM growth sustained over 12 months
- Starting MRR: $10,000
- Month 12: $10,000 × (1.15)^12 = $53,506
$10,000 × (1.15)^12 = $53,506 = 5.35x multiplier15% MoM = 435% annual growth
Why it matters: sustained 10% MoM growth is aggressive. It compounds to roughly tripling a business in a year. A founder aiming for 15-20% MoM is aiming for 5-9x a year if it holds, which is far above what the median private SaaS company achieves (see benchmarks below).
| Monthly Rate | 12-Month Multiplier | Annual Growth |
|---|---|---|
| 6% | 2.0x | 100% (T2D3 “double”) |
| 9.6% | 3.0x | 200% (T2D3 “triple”) |
| 10% | 3.14x | 214% |
| 15% | 5.35x | 435% |
The 6% and 9.6% rows map to the "double" and "triple" years of T2D3, the growth path Battery Ventures' Neeraj Agrawal described in 2015.
Quick Tips
- Always use the previous month as your baseline.
- Convert to percentage by multiplying by 100.
- Include the negative sign for declining growth.
- Round to one or two decimal places for cleaner reporting.
MoM Rate vs Compounded Monthly Growth Rate (CMGR)
MoM Growth Rate
Measures growth between two consecutive months. It’s like a snapshot of your business growth.
Compounded Monthly Growth Rate (CMGR)
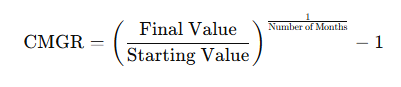
Measures average monthly growth over a longer period, smoothing out fluctuations. The formula is:
CMGR = (Final Value / Starting Value)^(1 / Number of Months) – 1
Key Differences:
- MoM Growth Rate: Short-term focus, can vary widely month to month, good for operational decisions.
- CMGR: Long-term focus, smooths fluctuations, better for strategic planning and investor presentations.
Who Should Use Month over Month (MoM) Growth Rate?
Startups and New Businesses
- Perfect for tracking early growth stages.
- Helps prove the business model is working.
- Essential for showing progress to investors.
- Useful for making quick adjustments to business strategy.
Online Businesses and E-commerce
- Track website traffic changes.
- Monitor online sales performance.
- Measure user signup rates.
- Evaluate marketing campaign success.
- Analyze customer engagement metrics.
SaaS Companies
- Monitor subscription growth.
- Track customer churn rate.
- Measure revenue increases.
- Evaluate feature adoption rates.
- Monitor user activity levels.
Small Business Owners
- Track monthly sales.
- Monitor customer growth.
- Evaluate seasonal patterns.
- Manage inventory needs.
- Plan staffing requirements.
Marketing Teams
- Measure campaign effectiveness.
- Track lead generation.
- Monitor social media growth.
- Evaluate content performance.
- Assess email marketing results.
Sales Teams
- Track monthly sales targets.
- Monitor deal closure rates.
- Measure pipeline growth.
- Evaluate team performance.
- Plan commission structures.
Product Managers
- Monitor product adoption.
- Track feature usage.
- Measure user engagement.
- Evaluate pricing changes.
- Plan product updates.
Who Should Not Use Month over Month (MoM) Growth Rate?
Highly Seasonal Businesses
Examples include ice cream shops, holiday retailers, and ski resorts. For these businesses, MoM can be misleading due to natural seasonal peaks. Year-over-Year (YoY) comparisons are more appropriate.
Long Sales Cycle Businesses
Examples include real estate developers, enterprise software sales, and large consulting firms. MoM growth isn’t suitable due to long deal cycles showing little or no monthly changes.
Project-Based Businesses
Examples include construction companies, film studios, and event planners. Revenue is tied to project completion, making MoM comparisons irrelevant.
Early-Stage Startups (First 3-6 Months)
Starting from zero can produce misleading growth rates. For instance, going from 2 to 4 customers shows 100% growth but lacks meaningful scale.
Businesses with Irregular Purchase Patterns
Examples include luxury car dealerships and industrial equipment sellers. Big-ticket sales create dramatic swings, making MoM an unreliable metric.
What is a Good MoM Growth Rate for Startups?
There is no single good number. What counts as good depends on how big the revenue base is, and most published benchmarks are annual, not monthly. Below are the figures that come from a named source, converted to a monthly rate where it helps. The conversion is compound: monthly rate = (1 + annual rate)^(1/12) − 1.
Very early: the Y Combinator yardstick (weekly, not monthly)
The most quoted early-stage target is weekly. Paul Graham wrote that "a good growth rate during YC is 5-7% a week" and that 10% a week is exceptional, measured on revenue, or on active users if you are not charging yet. 5% a week compounds to about 23.5% a month. These rates apply to a three-month batch off a very small base. Paul Graham notes that 5% a week for a year is 12.6x, so nobody sustains it for long.
Growth by ARR: what private SaaS companies actually do
SaaS Capital surveyed more than 1,000 private B2B SaaS companies on their 2024 year-over-year growth. Monthly equivalents are our conversion.
| ARR | Median YoY | Monthly equivalent | Top quartile YoY | 90th percentile YoY |
|---|---|---|---|---|
| Under $1M | 40% | 2.8% | 100% | 400% |
| $1M-$3M | 28% | 2.1% | 50% | 132% |
| $3M-$5M | 24% | 1.8% | 40% | 64% |
| $5M-$10M | 24% | 1.8% | 42% | 75% |
| $10M-$20M | 20% | 1.5% | 37% | 60% |
| Over $20M | 20% | 1.5% | 31% | 50% |
In SaaS Capital's words, "a $2 million SaaS company needs to be growing more than 50% year-over-year to be in the top 25% of its peers, whereas that bar is 31% growth for a company with $20 million of ARR." Its 2026 survey puts the overall median at 22% for 2025, down from 25%. Benchmarkit reports a similar 26% median and 50% top quartile for 2024.
The venture-scale path: T2D3
Venture investors often hold companies to a steeper line than the median. Battery Ventures' Neeraj Agrawal described it as "triple, triple, double, double, double" (T2D3) once a company reaches $2 million in ARR. Tripling in a year is about 9.6% a month sustained, and doubling is about 6% a month. Treat T2D3 as a target pattern for venture-backed companies, not as a typical result: the median company in the table above grows 20-40% a year.
Important caveat: growth rates off a tiny revenue base can be misleading. SaaS Capital calls this the "denominator effect": dividing by a small number produces very high growth rates. Doubling from $100 to $200 is 100% growth and says little about the business. Compare yourself with companies of a similar ARR, and look at the annual path, not one month.
How MoM Growth Feeds Your Runway Model
MoM growth rate is more than a vanity metric. It is the driver that determines how long your cash runway lasts. A slight change in monthly growth compounds across a 36-month forecast and can extend or shorten your runway by months or years. Read more in our guide to revenue growth rate and how it shapes your financial trajectory.
How it works: If you start with $10,000 MRR and maintain 12% MoM growth while your costs run $8,000/month above revenue (net burn), your revenue curve grows exponentially while costs stay flat. The gap closes, and eventually revenue overtakes costs, extending your cash runway significantly compared to flat revenue.
Example:
- Starting MRR: $10,000
- Net monthly burn: $8,000 (costs above revenue)
- Cash runway at 0% growth: ~15 months (assuming $120K in cash)
- Cash runway at 12% MoM growth: ~36+ months (revenue grows to overtake costs)
This is why investors focus on MoM growth: it directly impacts survival and fundraising timeline. A founder hitting 10% MoM can raise later (longer runway) and from a stronger position (higher revenue). A founder at 3% MoM burns cash faster relative to revenue gains.
To model your MoM growth impact on runway, use the Adlega runway calculator. Input your starting MRR, expected MoM growth rate, and monthly burn to see how many months of cash you have. Then explore scenarios: what if growth slows to 8%? What if you cut burn by 15%? Use cash flow forecasting to build a complete 36-month picture alongside your MoM growth targets. For a bigger-picture view, see how runway connects to burn and burn rates and building full financial projections for your fundraise.
MoM Growth Rate FAQ
How do you calculate MoM growth rate?
Subtract the previous month's value from the current month's, divide by the previous month's, and multiply by 100: ((Current − Previous) ÷ Previous) × 100. $10K → $12K = 20%.
What is a good MoM growth rate for startups?
It depends on your revenue base. At Y Combinator, Paul Graham called 5-7% a week good, about 23-34% a month, but that is a short sprint off a tiny base. Among private SaaS companies, SaaS Capital found median 2024 growth of 40% a year under $1M ARR (about 2.8% a month) and 20% a year above $10M ARR (about 1.5% a month). Venture-backed companies are often held to T2D3: tripling twice from $2M ARR, which is about 9.6% a month.
What's the difference between MoM and CMGR?
MoM compares two consecutive months, a quick snapshot. CMGR averages compounded monthly growth across a longer span, smoothing fluctuations for strategic planning.
Can you compound monthly growth rates?
Yes. A 10% MoM sustained for 12 months compounds to (1.10)^12 = 3.14x, or 214% annual growth. Not the same as 10% × 12 = 120%. This is why consistent month-over-month growth is powerful.
How does MoM growth impact my cash runway?
Growth rate is the primary driver of runway length. Higher MoM growth means revenue grows faster, widening the gap between revenue and burn. A 12% MoM growth rate can extend runway from 15 months to 36+ months. Use the runway calculator to model your specific scenario.
When should you not use MoM growth?
For highly seasonal, long-sales-cycle, or project-based businesses, and very early startups growing off a tiny base, MoM swings mislead. Year-over-year is steadier there.
Related growth-rate metrics
- Revenue Growth Rate, the headline period-over-period revenue metric, start here.
- Month-over-Month (MoM) Growth Rate, short-term, month-level momentum. (you are here)
- Compounded Monthly Growth Rate (CMGR), smoothed average monthly growth across a span.
- CAGR (Compound Annual Growth Rate), compound growth across multiple years.
- Customer Growth Rate, growth in customer count, not revenue.