


Churn rate is the percentage of customers (or revenue) you lose over a period: customers lost ÷ customers at the start × 100. A good annual churn rate is ~5–7% for mature SaaS and under 1% monthly; early-stage startups often run 10–15%. This guide covers benchmarks by industry and segment, what good looks like at your stage, the retention side of the equation (GRR and NRR), and how to bring churn down.
Looking for the calculation itself? The churn rate formula page covers how to calculate it step by step, which denominator to use, customer versus revenue churn, and how to convert monthly churn to annual.
Key Takeaways
- The churn rate shows the share of customers who stop using a company’s product or service in a certain period.
- High churn rates can lead to less revenue, higher costs to get new customers, and limits on growth.
- Low churn rates mean good customer loyalty and a solid business model.
- Different things can cause customer churn, so knowing these reasons is what lets you pick the right retention strategies.
What is the Churn?
What is Customer Churn?
The churn rate, or customer turnover rate, is a key company metric. It shows how many customers are lost over time (monthly, annually, or less often weekly or daily (so-called the daily churn rate).
This KPI is important for businesses, especially those with subscription-based models, as it affects revenue and profitability in the long run.
Why is Churn Rate in Business Important?
The churn rate is important for businesses as it tells you about customer happiness, loyalty, and the company’s overall performance.
Having a high churn rate can create serious problems in several ways:
- Revenue drop: Losing customers means losing money that regularly comes in.
- Spending more on getting new customers: It’s usually pricier to get new customers than to keep the ones you’ve got. So, if many customers leave, businesses must keep throwing cash into getting new ones.
- Slower growth: If customers keep ditching you, growing and expanding is hard. Instead of focusing on cool new stuff, the company has to keep replacing the ones that left.
- Falling behind the competition: Unhappy customers might switch to better competitors, eroding your market position.
How to Calculate Customer Churn Rate?
Customer churn rate is calculated by dividing the number of lost customers in a specific time frame by the total customer count at the start of that period, then showing it as a percentage.
Here’s the churn rate formula:
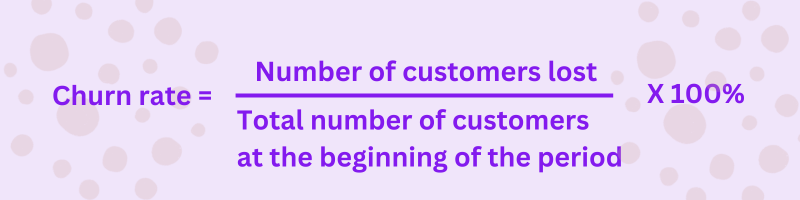
Churn Rate = (Customers Lost ÷ Customers at Start of Period) × 100Customer churn rate formula
That is the headline formula. The details that change the answer, which denominator to use when you have added customers mid-period, how customer churn differs from revenue churn, why you compound monthly churn instead of multiplying it by 12, and the cohort method, are covered in full on how to calculate churn rate.
For instance, if a company started with 1,000 customers and lost 40 by the month’s end, the monthly churn rate would be: Monthly churn rate = (40) / (1,000) x 100 = 4%
The timeframe for calculating the churn rate can vary based on the business and industry. Some companies do it monthly, others quarterly or annually. It all depends on factors like their revenue model, customer lifetime value, sales cycle, and how loyal their customers are.
What Drives Customers to Churn?
Several things can lead to customers leaving, and knowing these reasons is what lets you pick the right strategies for keeping them.
Some common causes of customer churn:
1. Product or service quality concerns: When a product or service doesn’t meet customer expectations or provide value, they might turn to competitors.
2. Perceived lack of value: Customers might leave if they feel they’re not getting enough bang for their buck, whether it’s due to costs, features, or not quite meeting their needs.
3. Issues with customer support: If the service isn’t up to par, slow responses or lack of personal touch can leave customers feeling frustrated and looking elsewhere.
4. Troubles with pricing: Unfair, unclear, or uncompetitive pricing models can push customers away to better alternatives.
5. Rival offerings: When newer and possibly better options arise, customers may be enticed to switch to something that suits them better or offers more value.
How to Reduce / Improve Customer Churn Rate?
Businesses can use several strategies to keep customers returning for more and boost loyalty.
Some strategies to consider:
1. Make Your Product Awesome: Keep tweaking your product based on what customers say, how they use it, and what’s hot in the industry.
2. Be There for Your Customers: Give top-notch, personalized support to build strong bonds and keep them hooked.
3. Rewards and Goodies: Treat your loyal customers with discounts, special deals, or fun perks to keep them happy.
4. Listen Up and Take Action: Chat with customers, gather feedback, and fix any issues pronto to show you care.
5. Smart Moves with Data: Use customer info wisely to spot those who might leave and run targeted campaigns to keep them around.
6. Price It Right and Show Off the Value: Keep an eye on pricing and ensure customers see the great value they’re getting.
7. Get Them Started Right: Offer clear guides and resources to help customers get the most out of your product or service.
What is Churn Analysis?
A churn analysis looks at customer data and behavior to spot patterns that could lead to churn. It means examining different customer journey data like demographics, usage patterns, feedback, and support interactions to figure out why customers leave and come up with ways to keep them around.
Analyzing churn gives businesses key insights into the following:
1. Customer Segments: Finding which customer groups churn more helps tailor retention efforts to fix specific issues.
2. Churn Triggers: Knowing what leads to customers leaving lets businesses step in early to stop it.
3. Product or Service Issues: Checking customer feedback and usage data uncovers any problems with what a company offers.
4. Customer Lifetime Value (CLV): Understanding what affects how long customers stick around helps focus on the most valuable ones.
5. Competitor Analysis: Keeping an eye on feedback and market trends shows how rivals’ moves might affect churn.
How Can I Track Churn?
Businesses can keep an eye on churn by checking out what customers are up to through different channels and data sources like:
1. Customer Relationship Management (CRM) Systems: These platforms give you a lowdown on customer stuff, such as what they buy, how they talk to you, and how engaged they are.
2. Usage Data: See how customers use your stuff – like how often they log in, what features they like, and how much they’re into it.
3. Survey Responses: Ask customers how they feel with regular surveys to spot problems, find ways to do better, and figure out why they might leave.
4. Support Interactions: Look into support stuff like tickets, chats, and feedback to see what bugs people or makes them mad.
5. Subscription or Billing Data: Keep an eye on renewals, failed payments, and cancellations to understand why customers might leave.
What’s a Good / Reasonable Churn Rate?
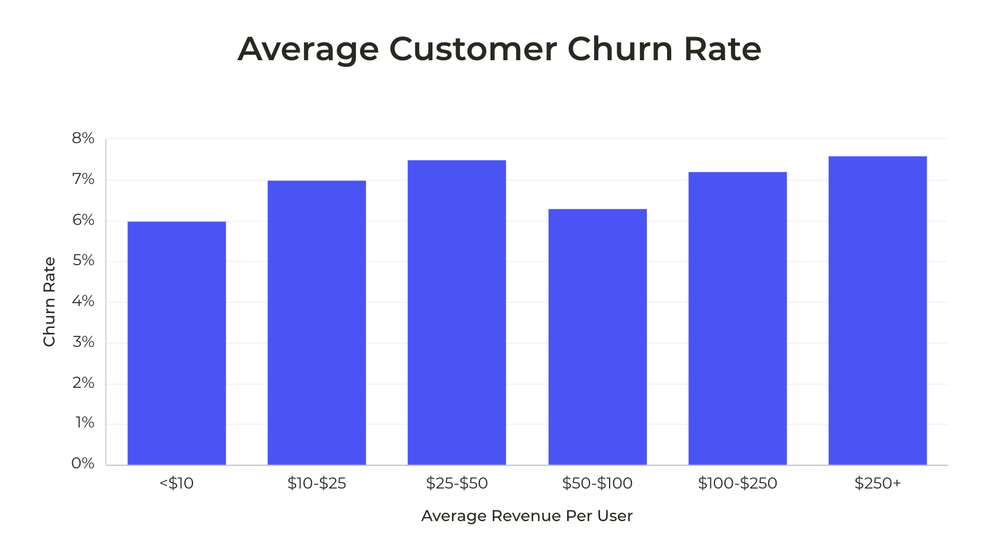
There’s no one-size-fits-all good churn rate – it varies based on industry, business model, and customers.
For mature and established companies, aiming for a churn rate of around 5% to 7% annually and less than 1% monthly is ideal. Early-stage startups or small businesses usually see a churn rate of about 10% to 15%.
Different industries and business models have different benchmarks – some with high switching costs have lower churn rates, unlike those with easy subscription changes.
What Does a High Churn Rate Mean?
A high churn rate is a warning sign for a business, showing that customers aren’t happy with the product or service and leave too often. Here are some things that can happen with a high churn rate:
1. Revenue Drop: When customers leave, the business loses money regularly, which lowers the total revenue and profits.
2. More Costs to Get Customers: To keep or get new customers? The business has to spend more on getting them than keeping them.
3. Less Room to Grow: If many customers leave, it’s difficult for the company to scale since they’re busy replacing lost customers instead of investing in growth and new initiatives.
4. Losing Out to Competition: Unhappy customers who leave might go to other companies with better stuff, making those companies more popular.
5. Bad Reputation: A high churn rate can hurt how people see the company, as unhappy customers might tell others about their bad experiences, stopping potential new customers from joining.
Churn and Other KPIs
What is Churn vs Turnover?
While churn and turnover are related, they differ in important ways.
Churn refers to customers who stop using a product or service. It applies especially to subscription services.
On the flip side, turnover is broader – it’s about all kinds of departures in a company, like losing customers, employees, you name it. It’s the slow leak of people or assets over time for reasons like quitting, retiring, or just life happening.
When we talk about customers, churn rate hones in on loyalty, while turnover gives the big picture of who’s coming and going in a business.
What is the Difference Between Churn Rate and Retention Rate?
Churn rate and retention rate are related metrics that provide different perspectives on customer loyalty and longevity.
Churn Rate is the percentage of customers who stop using a product or service over time, showing how many are leaving.
Retention Rate, by contrast, shows the percentage of customers continuing to use a product or service, indicating how many remain.
It’s like this equation: Retention Rate = 1 – Churn Rate.
If a business has an annual churn rate of 4%, its annual retention rate would be 96%.
Does Churn Rate Affect Retention?
Absolutely. When we talk about churn rate, we’re measuring how many customers decide to stay. If the churn rate goes up, more customers are leaving, leading to lower retention.
Conversely, a lower churn rate means more customers are staying with you, boosting those retention numbers. Churn and retention are inversely related: as one goes up, the other goes down.
Retention Metrics: GRR vs NRR
Churn measures what you lose; retention measures what you keep, and for SaaS the two revenue-retention metrics that matter most are computed from the same cohort:
- Gross revenue retention (GRR), revenue kept from existing customers, excluding expansion. It can never exceed 100%. Formula: (starting MRR − churn − contraction) ÷ starting MRR. The 2024 median sits around 88% (Benchmarkit 2025).
- Net revenue retention (NRR), the same, but including expansion, so it can exceed 100%. Formula: (starting MRR − churn − contraction + expansion) ÷ starting MRR. The blended median is about 101%, but that hides the segment split: enterprise (>$100K ACV) runs ~118%, SMB (<$25K) ~97% (Benchmarkit 2025).
GRR is the floor (how leaky the bucket is); NRR tells you whether expansion more than refills it. Above 100% NRR, your existing base grows on its own before a single new sale. For a side-by-side breakdown of the two, see NRR vs GRR.
The Net-New-MRR Bridge
Churn, contraction, and expansion aren't separate reports, they net together into the single equation that drives a SaaS revenue forecast:
New + Expansion − Contraction − Churn = Net New MRRThe bridge that turns retention into a growth number
This is why retention is a revenue problem, not just a support one: cut churn or lift expansion and the bridge compounds; ignore them and new sales just refill a leaking bucket. Adlega builds this exact bridge, customer, MRR, and net-negative churn plus expansion, inside your financial model, so a churn assumption flows straight through to ARR, NRR, and valuation.
Why Retention Beats Acquisition
Keeping a customer is far cheaper than winning a new one, and it compounds: Bain's Fred Reichheld found that increasing retention by 5% can lift profits anywhere from 25% to 95%, depending on the industry (Reichheld & Sasser, Harvard Business Review, 1990). Retained customers also expand, the base you keep is the base that upgrades and buys more. That's why the best SaaS companies treat retention as their primary growth lever, and why investors read NRR as a leading signal of durable growth. It also flows straight into unit economics: longer retention raises LTV, which lifts your LTV:CAC.
What is the Difference Between Growth Rate and Churn Rate?
Growth rate and churn rate are two metrics that show different sides of how well a business is doing. They are closely related, and looking at them together gives you the complete picture of customer retention and growth potential.
Growth Rate tracks how fast a business gets new customers or grows its customer base. You can work it out by dividing the new customers gained in a period by the total customers at the start of that period.
Churn Rate is about how fast a business loses customers.
A company can experience strong growth while still losing customers at high rates, suggesting retention issues. Conversely, slow growth with low churn could indicate loyal customers but difficulty acquiring new ones.
The ideal balance is solid growth combined with low churn. That combination signals an effective strategy for both retaining and acquiring customers. Strong growth with low churn is the foundation for long-term success.
Customer Churn Rate vs Revenue Churn Rate
Customer churn rate and revenue churn rate measure different aspects of customer loss. Customer churn rate shows the number of accounts you lost, while revenue churn rate measures the dollars you lost.
If you lose many small accounts, you have a high customer churn rate but a low revenue churn rate. Conversely, losing a few high-value accounts means a low customer churn rate but a high revenue churn rate.
What is the Difference Between Attrition and Churn?
Attrition and churn are related concepts in customer retention and business performance.
Attrition is all about slowly losing customers or employees over time. It happens With customers when they decide not to use a product or service anymore for reasons like not being happy, their needs changing, or finding better options.
Churn, on the other hand, is about how many customers stop using a product or service within a specific period.
Examples of Churn Rate
1. Subscription-based Services:
- Streaming services like Netflix or Spotify: the churn rate shows the percentage of subscribers canceling within a certain time.
- Software-as-a-Service (SaaS) companies: the churn rate watches the percentage of customers hitting pause on their software subscriptions or forgetting to renew their licenses.
- Gyms or fitness clubs: the churn rate measures the percentage of members canceling or not renewing.
2. Telecommunications:
- Cable TV or internet service providers: the churn rate counts customers leaving or switching providers.
- Mobile network operators: the churn rate tracks subscribers leaving to switch networks or cancel their mobile services.
3. Financial Services:
- Banks or credit card companies: the churn rate looks at the customers closing their accounts or changing financial tunes.
- Insurance companies: the churn rate measures policyholders canceling or not renewing their policies.
4. E-commerce and Retail:
- Online retailers or e-commerce platforms: the churn rate tracks customers who stop purchasing or become inactive within a timeframe.
- Subscription box services: the churn rate counts subscribers canceling or pausing their subscriptions.
5. Online Gaming:
- Massively multiplayer online games (MMOs) or virtual worlds: the churn rate is all about the players or users who stop playing within a given period.
Churn rate in SaaS
What is Churn Rate in SaaS?
The churn rate in the Software-as-a-Service (SaaS) industry is about the percentage of customers who decide to cancel or don’t renew their subscriptions within a certain timeframe, like a month or a year. It’s a super important metric for SaaS businesses since it affects their recurring revenue and potential for growth.
What is a Good Churn Rate in SaaS?
A good churn rate in the SaaS industry can vary based on factors like software type, target market, pricing model, and industry standards. Generally, a churn rate under 5% per year is seen as excellent, while rates between 5% and 7% are considered good or acceptable for most established SaaS businesses. Churn rates may shift depending on the subscription term or billing cycle.
SaaS Churn Benchmarks
Based on industry reports and SaaS churn benchmarks, SaaS businesses usually see an average churn rate of 5% to 15% each year. However, this can change a lot depending on factors like how mature the business is, its pricing model, who its customers are, and how tough the competition is.
For instance, new SaaS startups or those going after small businesses might face churn rates of over 10 – 15% yearly as they figure out their product fit and how to get more customers.
On the flip side, established SaaS companies dealing with big clients and long contracts tend to have lower churn rates, often below 5% annually, because of the higher switching costs and the longer sales process.
| Business type | Typical annual churn |
|---|---|
| Established / enterprise SaaS | < 5% |
| Mature SaaS (general) | 5–7% |
| SaaS average (all stages) | 5–15% |
| Early-stage / SMB-focused SaaS | 10–15%+ |
E-Commerce Churn Rate
In e-commerce, the customer churn rate shows how many customers stop purchasing within a set time, such as a year or a quarter. It is important for e-commerce businesses because it affects customer lifetime value and overall profitability.
To figure out the churn rate, you take the customers who didn’t buy anything in that time and divide by the total at the start, then multiply by 100 for the percentage.
For instance, if a business had 40,000 customers and 2,000 didn’t buy anything in a year, their churn rate would be 5%: (2000 / 40000) * 100 = 5%
Other Frequently Asked Questions about Churn
Difference between Gross Churn and Net Churn
Gross churn and net churn are related but distinct. They both measure how many customers cancel subscription services.
The gross churn rate counts total customers lost at a specific time, ignoring any new customers acquired. You calculate it by dividing lost customers by total customers at the start of that time.
The net churn rate is more informative. It accounts for both customers lost and new customers gained at that same time. You calculate it by subtracting new customers from lost customers, then dividing by the total customers at the start. A negative net churn rate indicates that new customer additions outweigh losses.
If the gross churn rate is high but the net one is low or negative, it means the business is bringing in enough new customers to make up for the losses, which is a good thing for growth. But watch out if both rates are high – it could mean trouble with keeping customers or getting new ones.
Can You Predict Churn?
You can predict churn using different analytical techniques and data-driven approaches.
One common way is by using machine learning algorithms and predictive modeling. These algorithms dig into customer data like usage patterns, demographics, payment history, and interactions to spot signs of potential churn risk.
For example, a machine learning model that’s been trained using customer data might flag customers who haven’t logged in recently, raised multiple support tickets, or had billing issues as likely to churn soon.
Another cool method is survival analysis, which predicts how long a customer might stay subscribed. It calculates the chances of churn at various points based on customer traits and behavior.
Businesses can also turn to customer feedback from surveys or NPS scores to pinpoint unsatisfied customers who might churn.
What is a Negative Churn Rate?
A negative churn rate represents an excellent outcome for a business. It occurs when revenue from existing customers (through upgrades, add-ons, or expansions) exceeds the revenue lost from customers leaving or downgrading.
So, even after some customers leave, the overall revenue from existing customers continues to grow. This is also known as “revenue expansion” or “negative revenue churn.”
To figure out this negative churn rate, businesses need to subtract the money gained from existing customers (from upsells or cross-sells) from the money lost due to customer churn. Then, divide that by the total revenue at the beginning of the period.
For example, a SaaS company started the month with $2 million in monthly recurring revenue (MRR), lost $40,000 because of churn, but gained $80,000 from upsells and expansions.
Their negative churn rate would be -2%.
Negative Churn Rate = [($40,000 – $80,000) / $2,000,000] x 100% = -2%
This negative churn rate shows that the business is not only retaining customers but also increasing revenue from them, which accelerates growth and improves profitability.
SaaS Churn & Retention FAQ
What is a good churn rate for SaaS?
Roughly 2–5% monthly for SMB-focused SaaS, and lower (often well under 1% monthly) up-market. On an annual basis, best-in-class logo churn runs single digits. Judge against your segment, enterprise churn is far lower than SMB, and always measure it cohort-based, not as a single blended average.
How do you calculate churn rate?
Customer (logo) churn = customers lost in a period ÷ customers at the start. Revenue churn = MRR lost ÷ starting MRR. Use the calculator on this page to run your own numbers, and see monthly churn rate for the period conversions.
What's the difference between customer churn and revenue churn?
Customer (logo) churn counts accounts lost; revenue churn counts dollars lost. They diverge when your churned customers are smaller or larger than average, losing many small accounts hurts logo churn more than revenue churn, and vice versa.
What's the difference between NRR and GRR?
GRR excludes expansion and caps at 100% (how leaky the bucket is); NRR includes expansion and can exceed 100% (whether expansion refills the leak). Median GRR is ~88% and median NRR ~101% (Benchmarkit 2025).
How do you convert annual churn to monthly?
It isn't a simple divide-by-12, because churn compounds. Approximate monthly churn as 1 − (1 − annual churn)^(1/12). A 30% annual churn is roughly 2.9% monthly, not 2.5%. See monthly churn rate.
How do you achieve negative churn?
When expansion revenue from existing customers (upgrades, seats, usage) exceeds the revenue lost to churn and contraction, net revenue churn goes negative and NRR exceeds 100%, see negative churn rate. It's the strongest growth signal in SaaS.
Churn and retention are inputs to your whole financial model, they set your runway, your unit economics, and ultimately your valuation. Model how a churn or expansion change flows through with the calculator below or in Adlega, where the AI CFO will trace the effect back through the bridge for you.